


Mamut
Program Mamut is designed mainly for commercial and medial agencies, but is used in sales and programme sections of television companies too. It consist of three large and independent modules that support a whole process of advertising campaign creation and evaluation. Besides that it is used for analysing individual respondents’ viewing (e.g. spectators of particular programme) and for analyses of TV price lists (e.g. DATA MEDIA). Each user can create his/her own buying conditions including discounts and position bonuses.
Mamut consists of three independent modules, which can be bought separately or as a package:

Strategic plan
is a module designed for strategic planning of advertising campaigns. Based on the data from chosen source time period it estimates reach figures (effective reach, effective frequency k+, histogram) for selected divisions of a campaign budget or GRP of a chosen target group. The GRP (budget) can be divided to TV channels and dayparts (media dayparts).
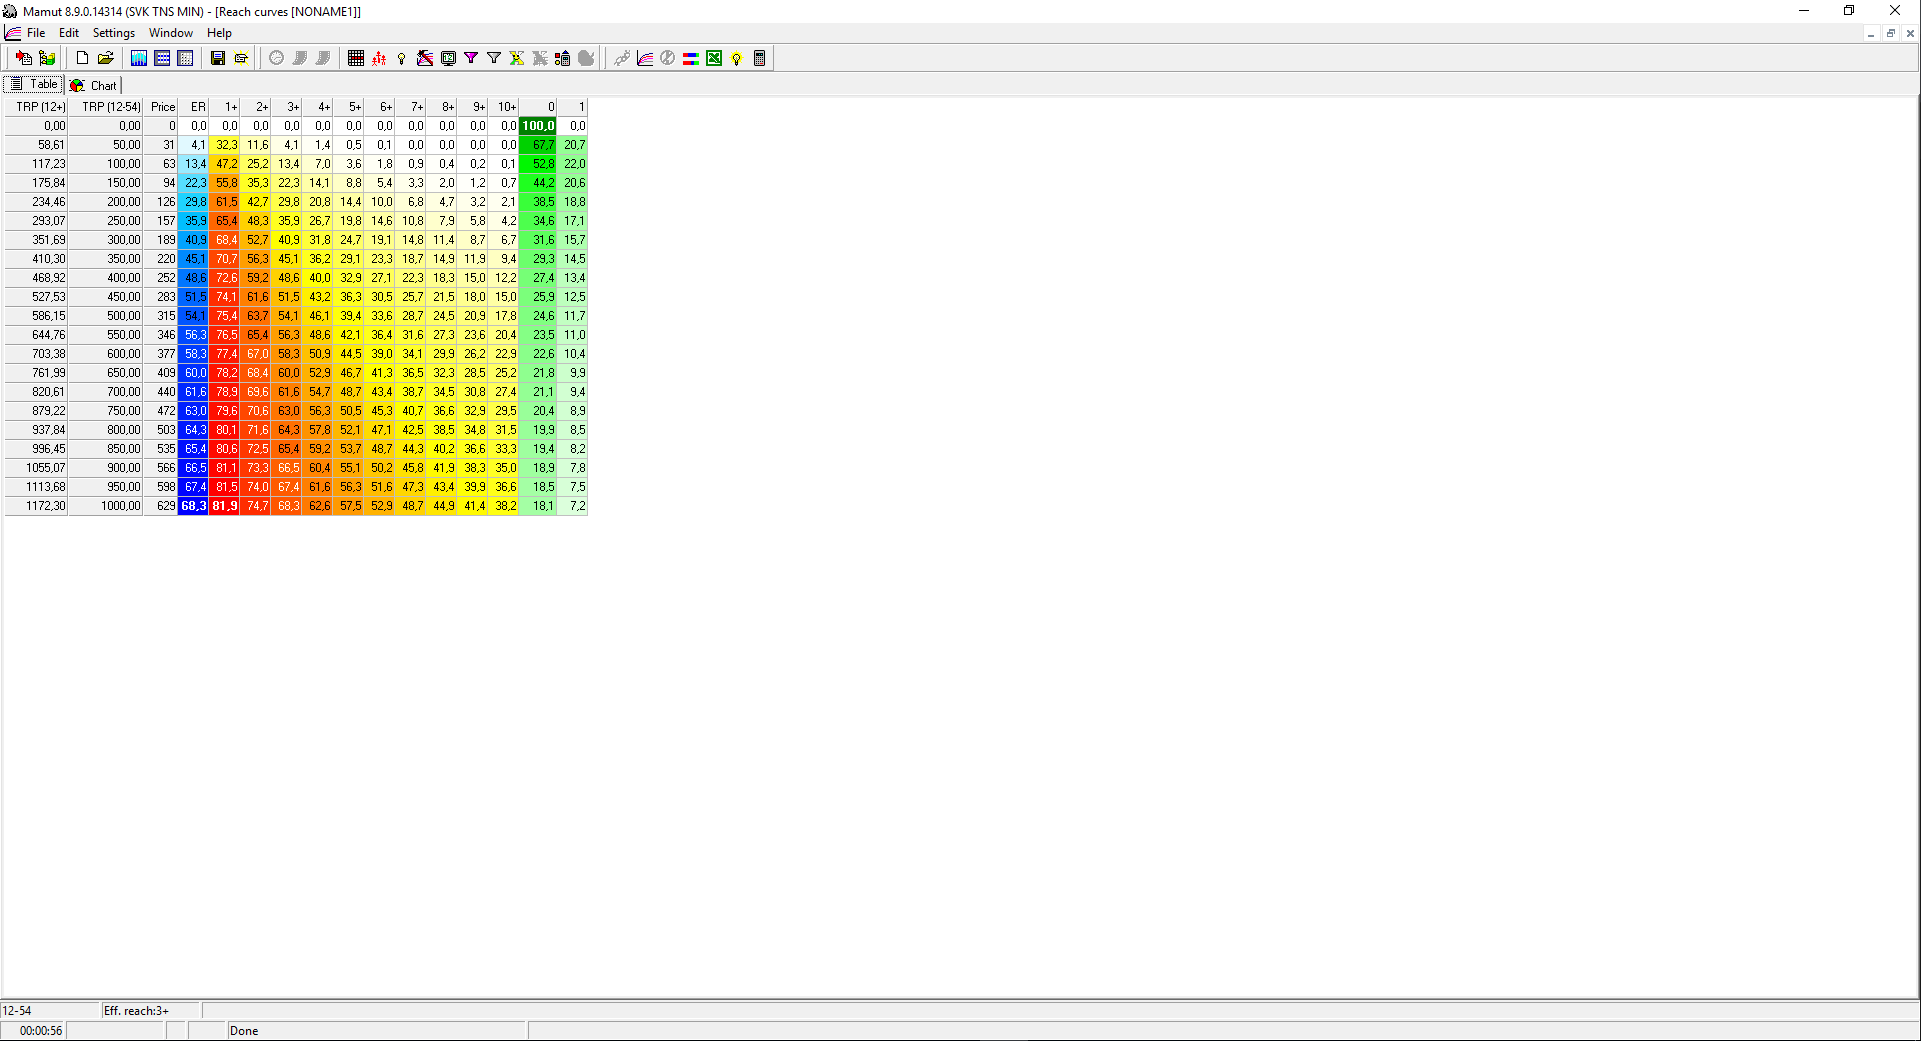
In this module you can also calculate and display several reach curves and reach surfaces and optimize the division of GRP or price between user-defined dayparts and TV channels.
The basic outputs of Strategic plan are:
- User created plan.
- Optimized plan – optimal division of campaign into user-defined dayparts on selected TV channels, based on user-defined criteria (e.g. maximizes number of reached people in selected target group by selected GRP).
- Accumulations – cumulative development of effective frequencies for user-defined division of concrete campaign for different levels of GRP.
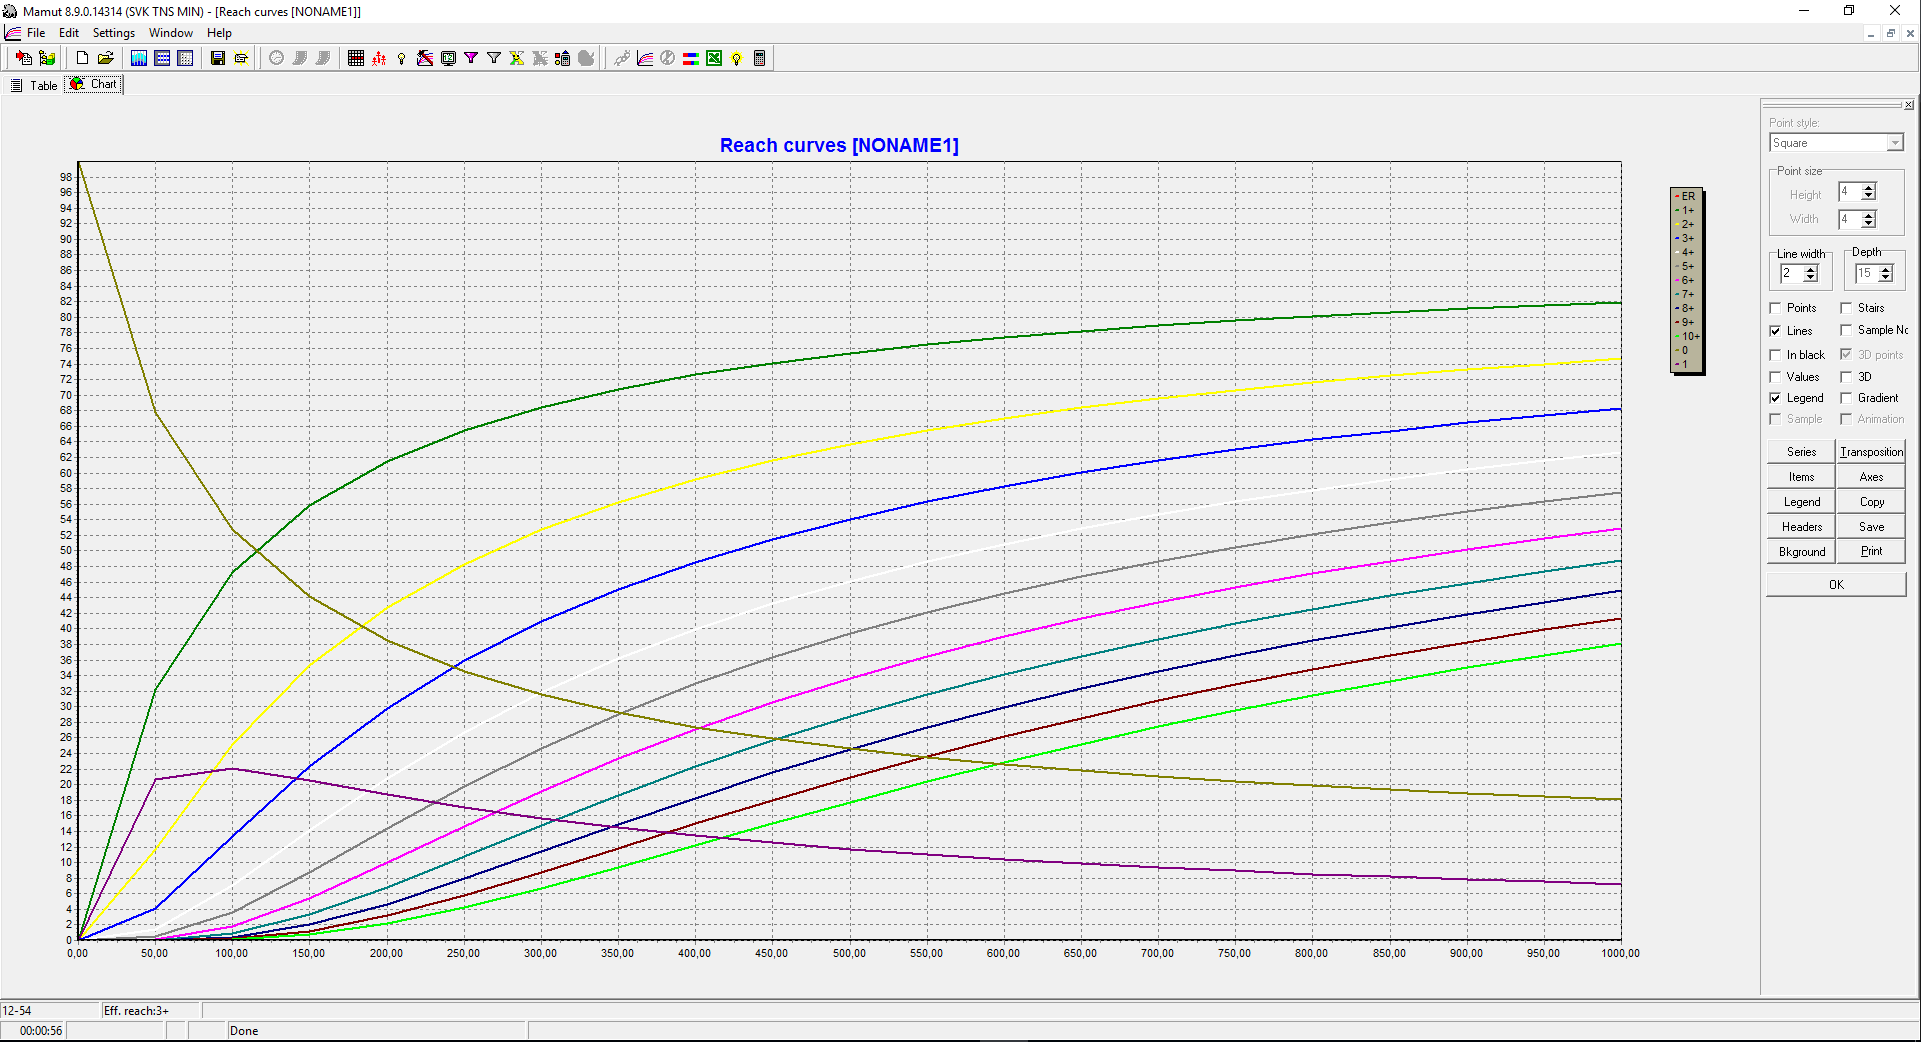
- Reach curves – cumulative growth of effective frequencies for normal division of GRP with possibility to limit this division by user-defined priorities for individual TV channels or dayparts.
- Reach surfaces – display of effective frequencies or effective reach corresponding with division of required GRP or price into selected TV channels.
- Other types of reach curves and reach surfaces.
The outputs of the strategic plan can be saved for future use in Mamut, exported into MS Excel or used as settings for Detailed plan. The reach curves can be also saved as a HTML document.
| show preview (Reach curves graph) |
| show preview (Reach curves table) |
| show preview (Strategic plan) |
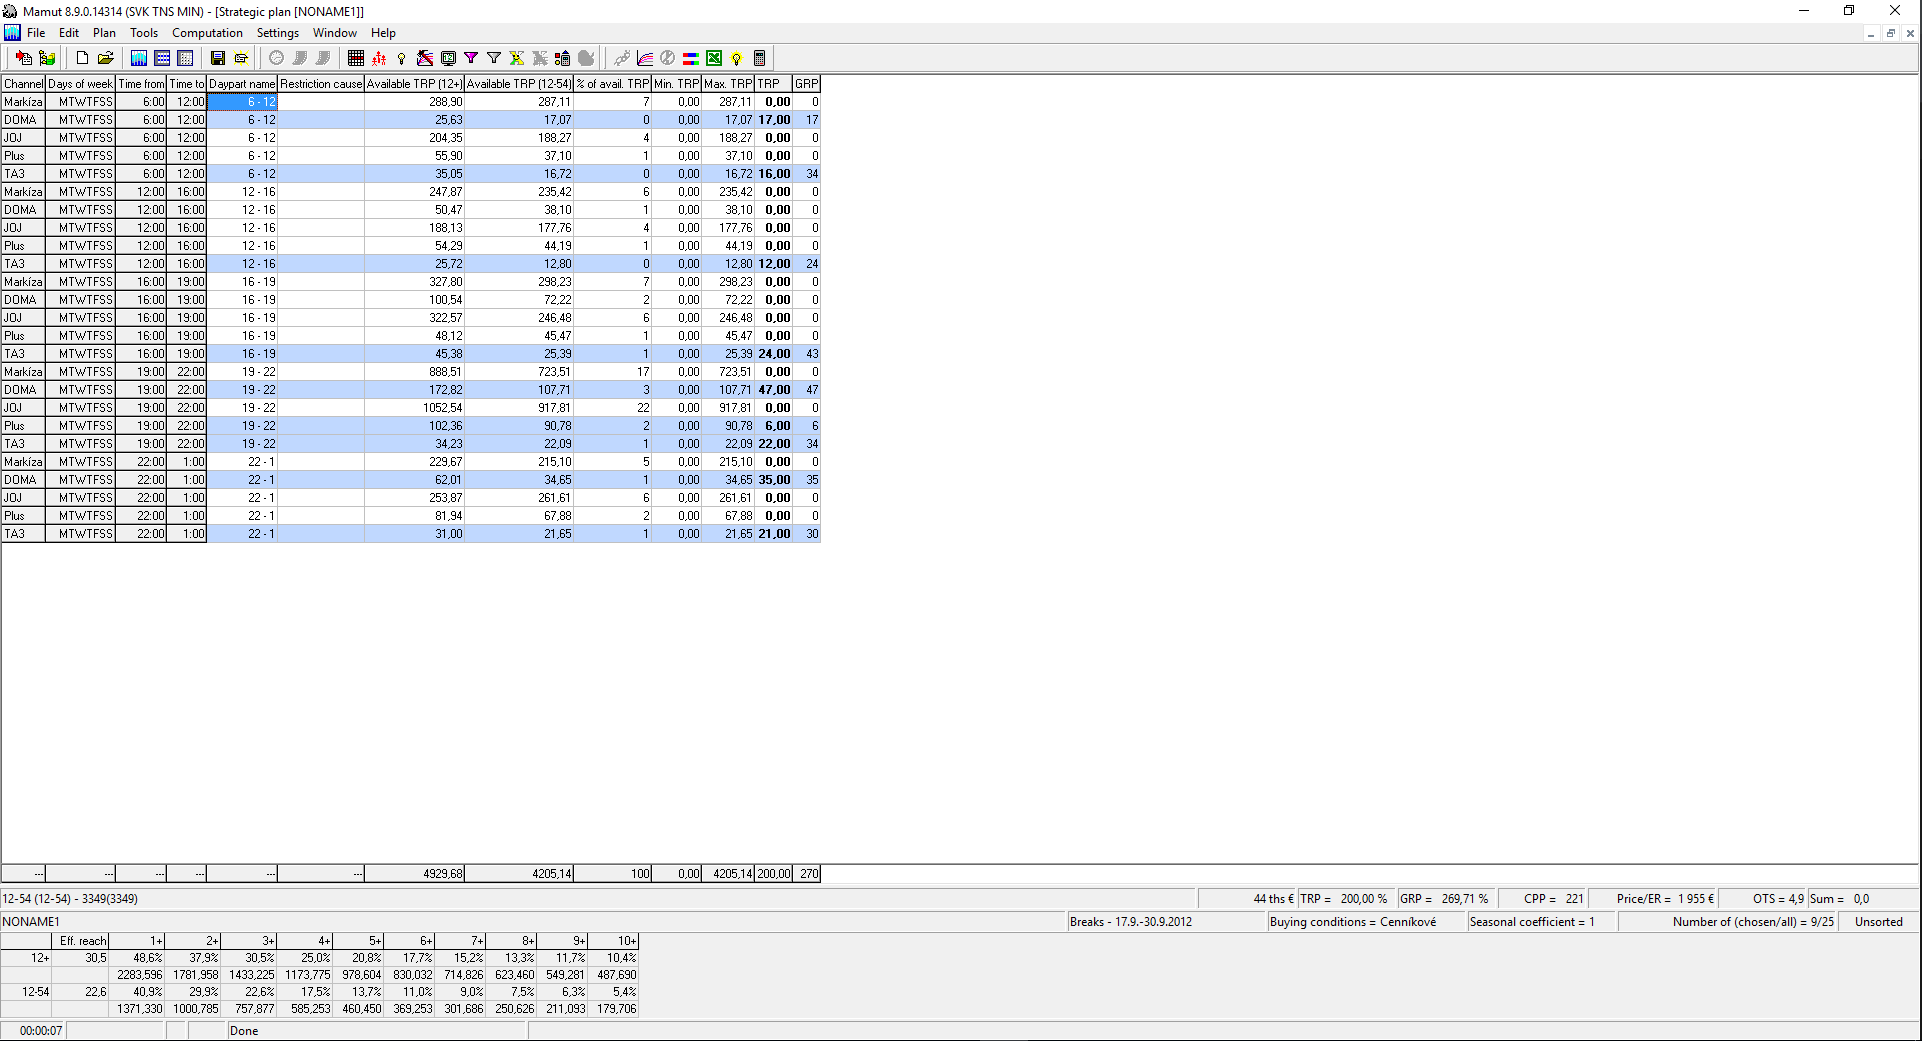
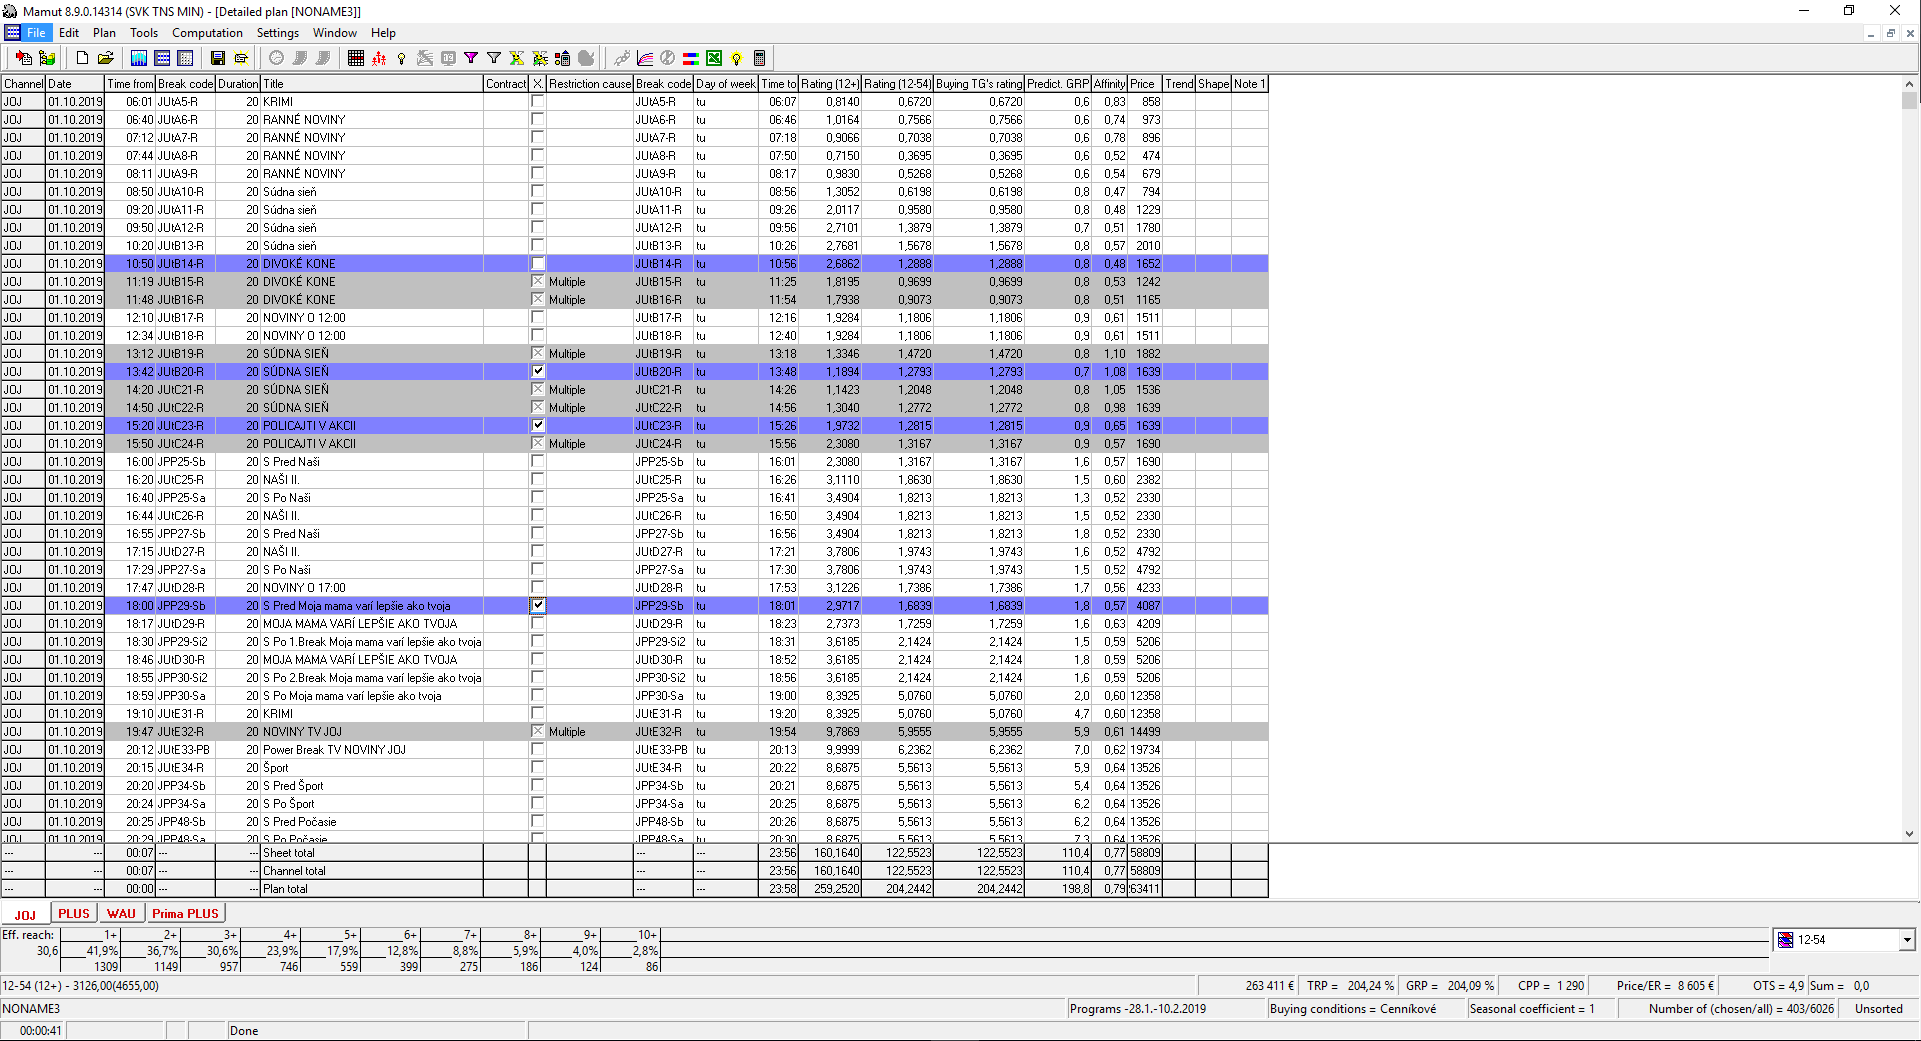
Detailed plan
supports creating of more specific, detailed TV advertisement campaign plans. Based on the data from chosen source time period it estimates various medial figures (e. g. rating, reach, affinity, ef. frequency…) for commercial breaks from database of electronic price lists schemes of each TV channel included in the TAM research.
You can pick commercial breaks from the programme scheme by your own with support of estimated medial figures and/or use a optimization module, which will select breaks automatically, accordingly to your priorities. To get the best results, when working with the Detailed plan, you can use several basic features and additional functions:
- User friendly choice of commercial breaks;
- Immediate calculation of cumulative figures including effective frequencies;
- User defined effective reach;
- User defined break duplicities;
- Optional filtering of breaks used in other campaigns;
- Optional filtering of breaks unfulfilling conditions (rating, price, CPT, CPP and affinity limits);
- Adjustable options for different TV stations;
- Fast data source breaks’ success overview;
- Cooperation with Strategic plan;
- Possibility to use an Optimization module for a plan recommendation based on;
- Maximalization of defined effective reach with given GRP or price;
- Minimimalization of GRP or price with given effective reach value;
- User-defined divisions of GRP (price) into TV channels, dayparts and time periods
The final campaign plan can be then exported to program Buying.
| show preview (Detailed plan) |
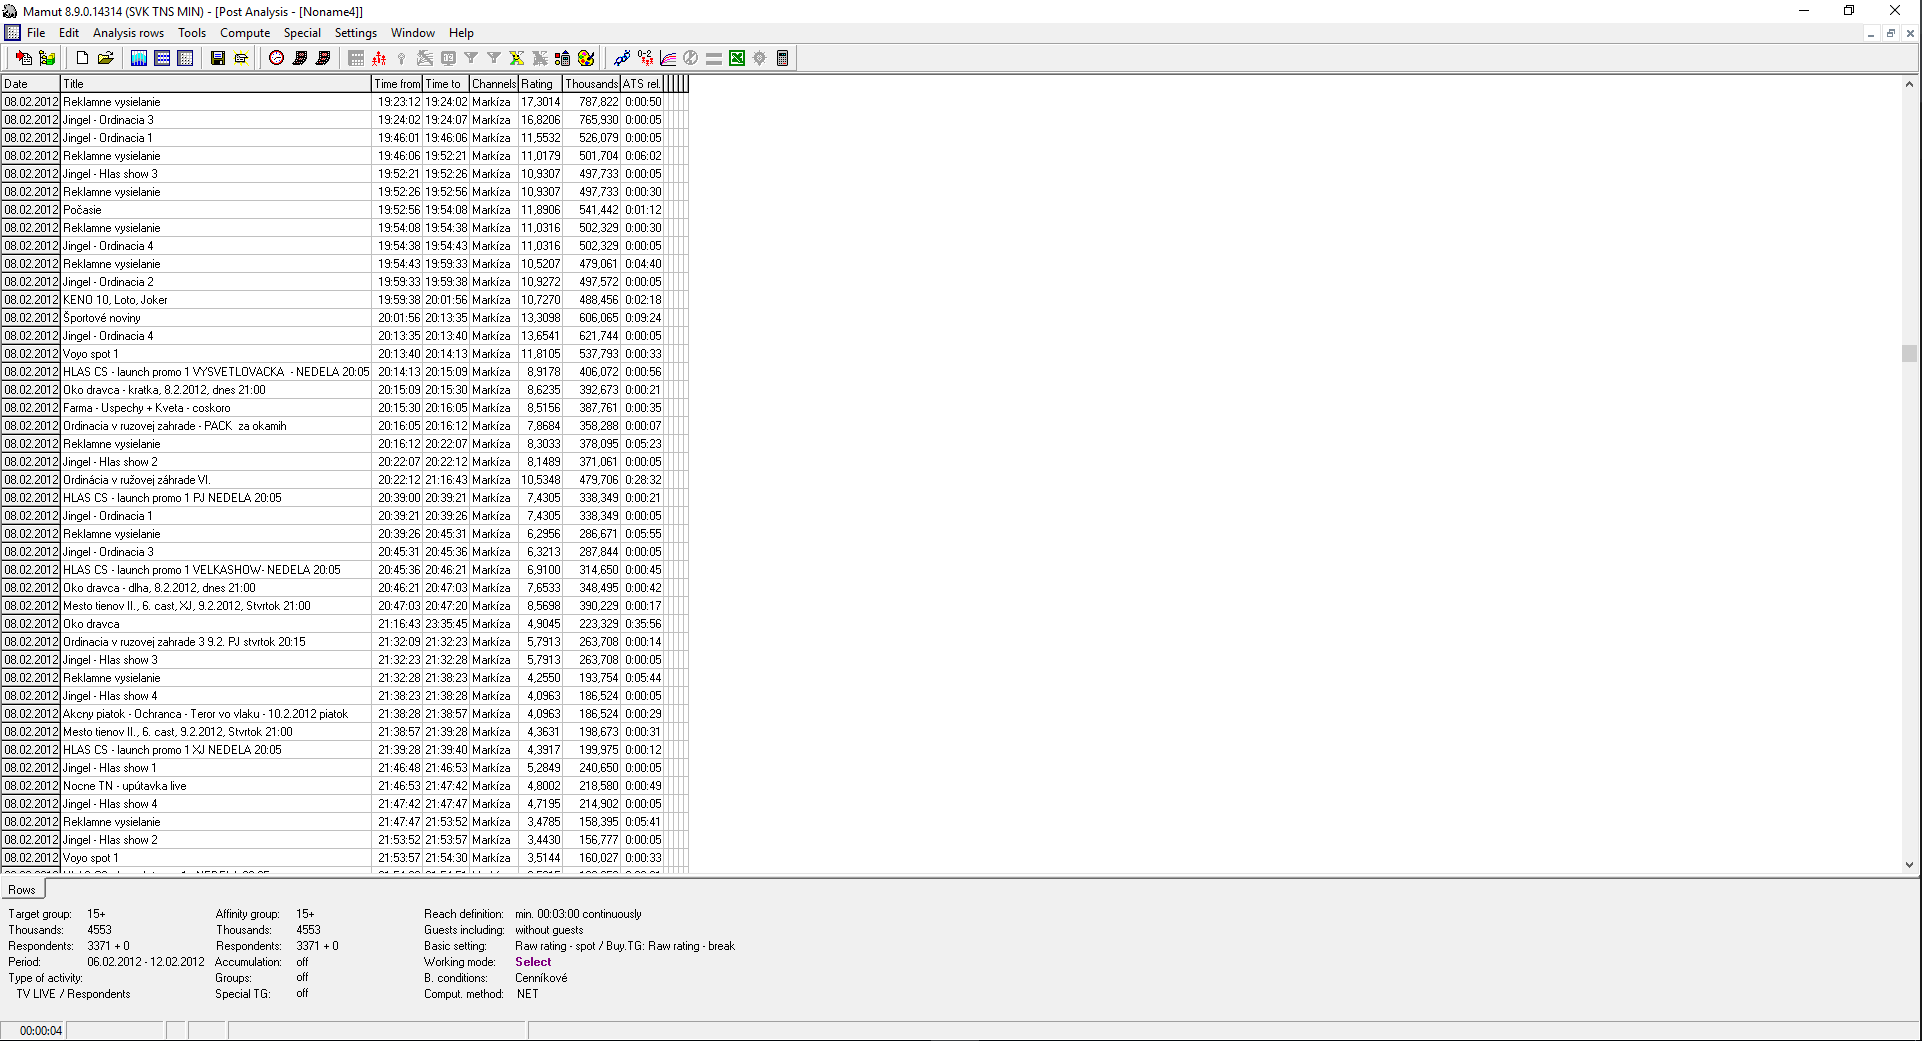
Analysis
is a first-class tool for complex analysis of the TV audience. It supports several different types of databases (programmes, spots, captions…) and can use them in one report together.
You can create there various comprehensive analyses of different types by using large scale of functions:
- Cumulative analysis – development of effective frequencies after broadcast of each part of the analysis;
- Creating of special target groups according to user-defined viewing habits of respondents;
- Multi-level cumulations with various specialized figures;
- Conditional, user-defined colouring of parts of analysis;
- Analysis of times surrounding programmes (e.g. average rating of 30 seconds before particular repeated programme);
- Possibility to find common and on the other hand inconsistent spectators of two selected programmes;
- Possibility to divide spectators into groups of rare, medium and strong spectators dependent on their ratings;
| show preview (Analysis) |