


Golem
Program Golem is an analytic tool that consists of several adaptable components for a complex analysis of spectators’ behavior based on the television audience measurement (TV meter) data. It processes calculated data about the televiewing with accuracy up to the seconds as well as various databases with information about analyzed time intervals – programmes, commercial breaks, spots or captions.
A special function of Golem is a batch processing that allows you to set and start almost unlimited number of different analyses at once and so helps you to fast process routine reports.


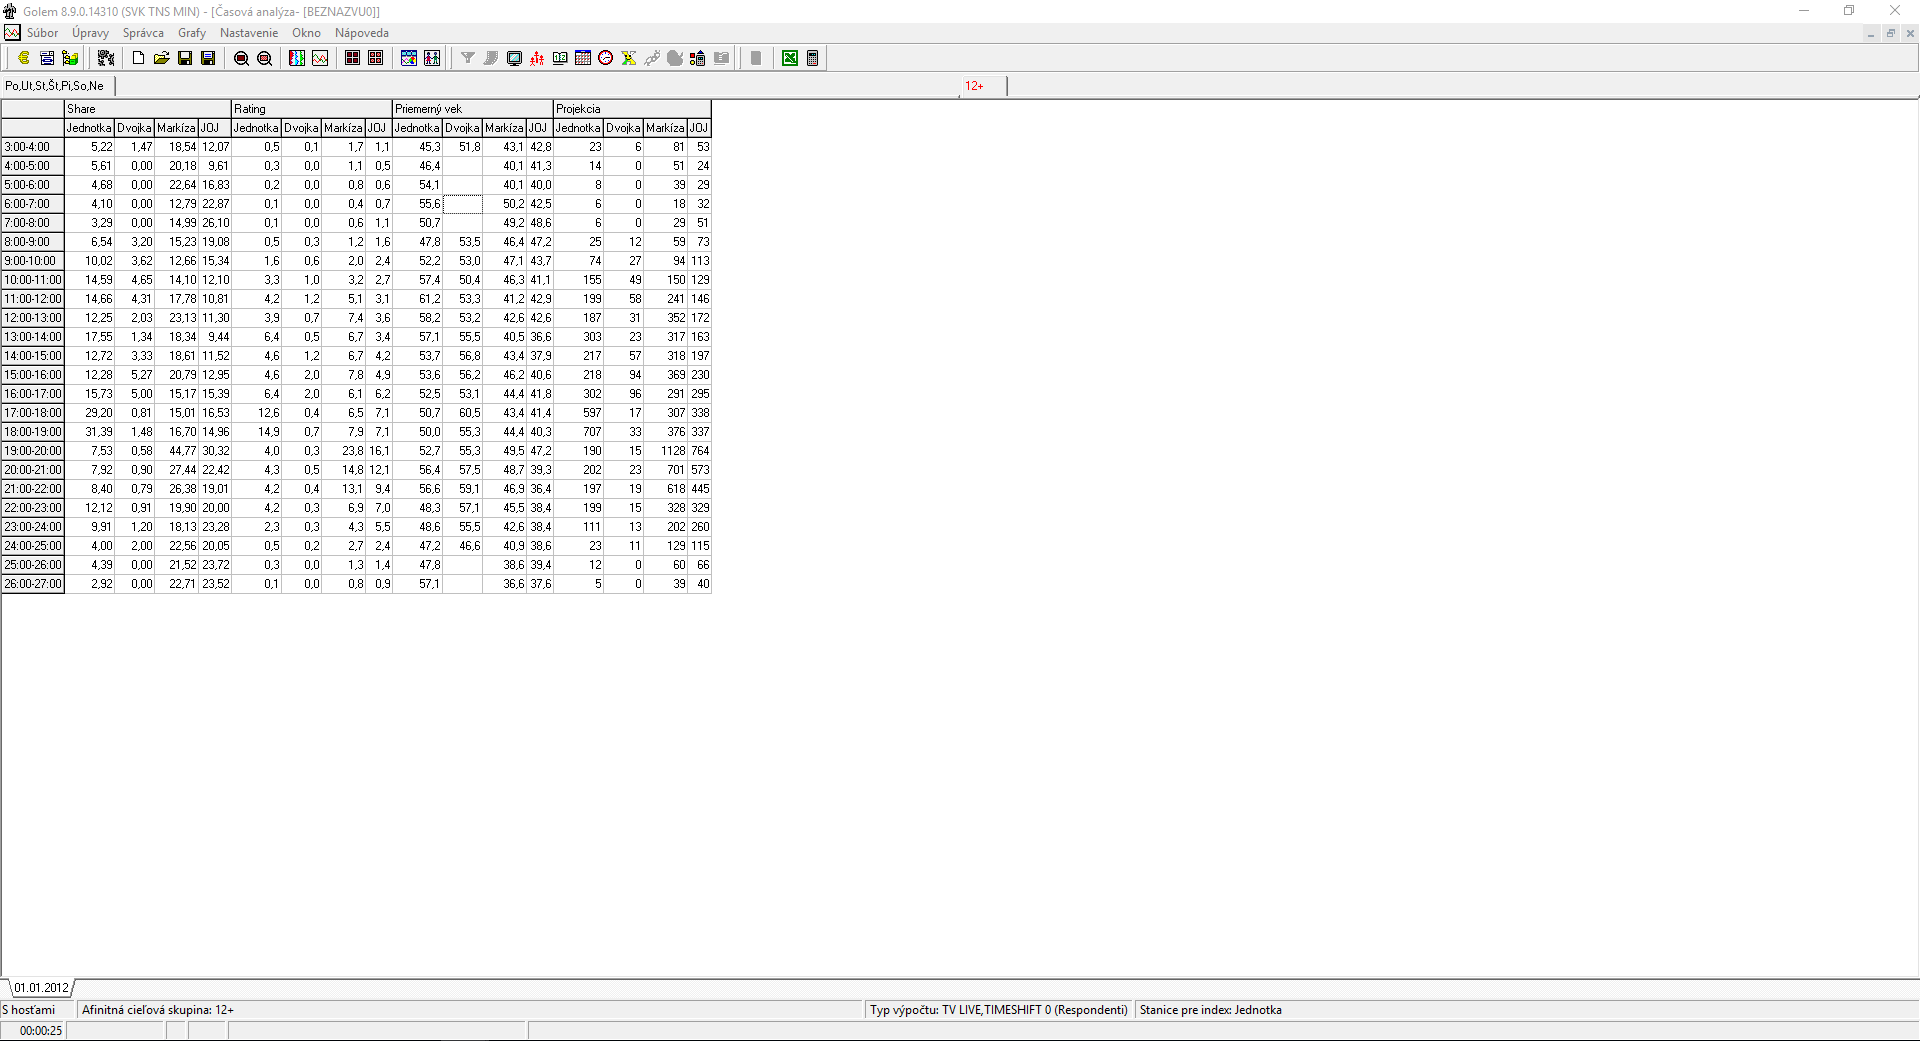
Time analysis
is used for analyzing user-defined time intervals. The output can be displayed either in tables or graphs. Besides mostly analyzed live broadcasting there is also possibility to examine other types of televiewing like teletext, recording and playing videos and using other connected devices (e.g. DVD, game consoles).
 |
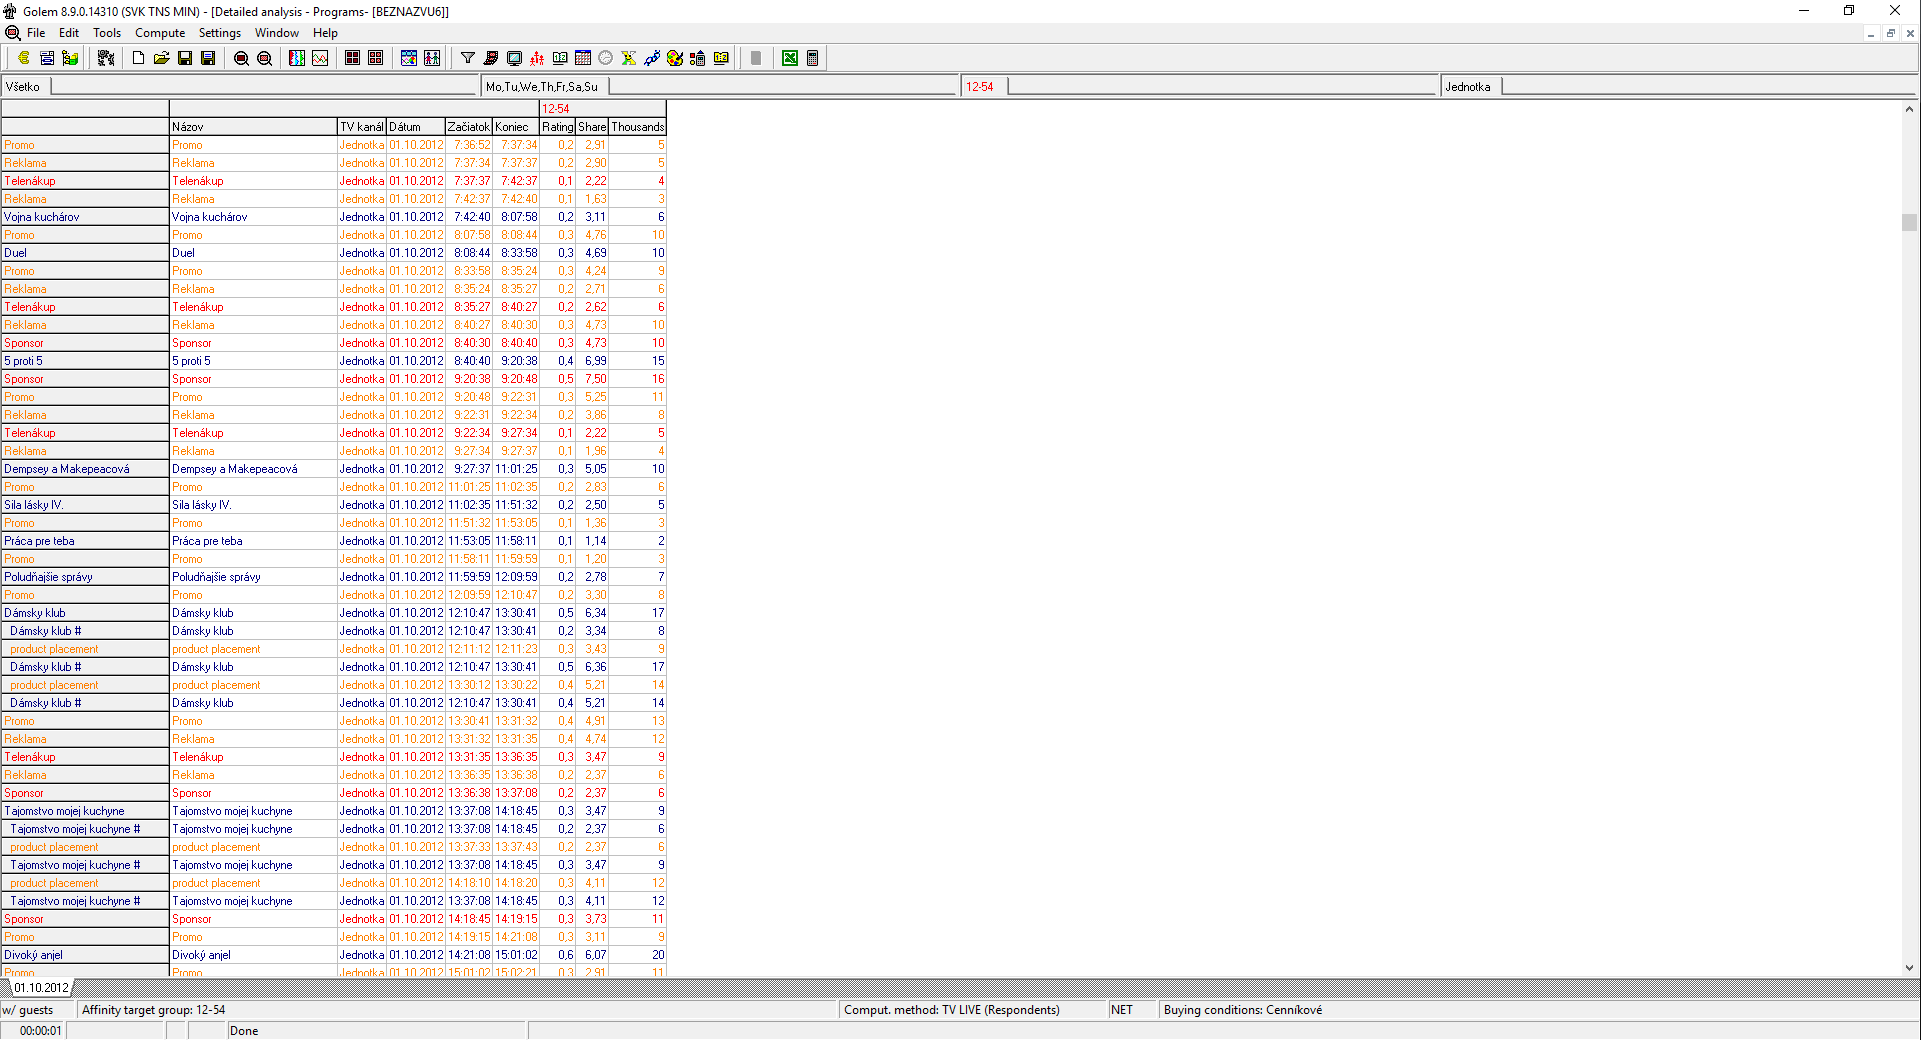
Detailed analyses
are used for analyzing programmes (breaks, spots, captions) from selected time period, dayparts, channels and corresponding with an user-defined filter.
You can for example find 10 films with highest rating in selected month or find all spots for beer and their price in first quarter of the year… The desired final output can be achieved by using additional functions like:
- Row cumulation (by selected criteria)
- Conditional colouring of parts of the analysis
- Conditional displaying of parts of the analysis
- Computed variables concerning also other channels (within the same time)
- Programmes levels
- Sort and trim
 |
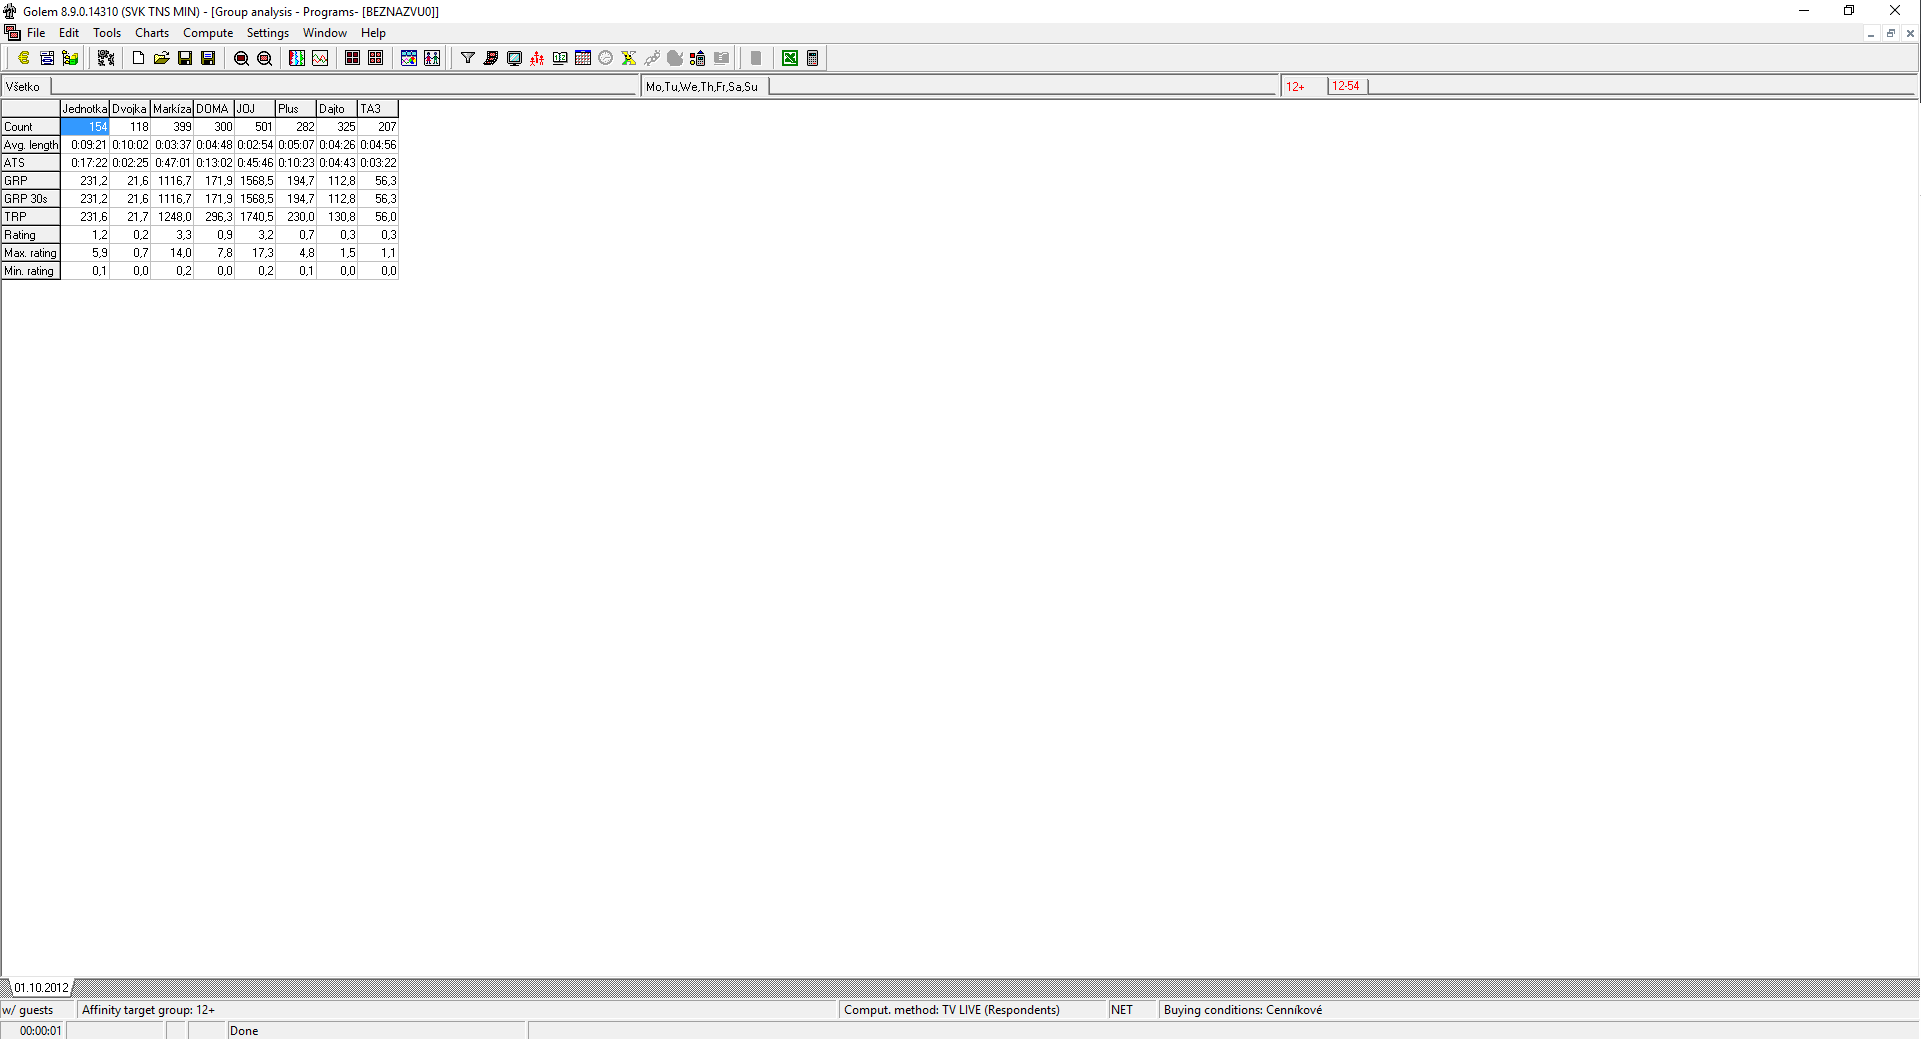
Group analyses
are used for analyzing user-defined groups of programmes (breaks, spots, captions).
You can for example compare total time of broadcasted commercials on different channels.
 |
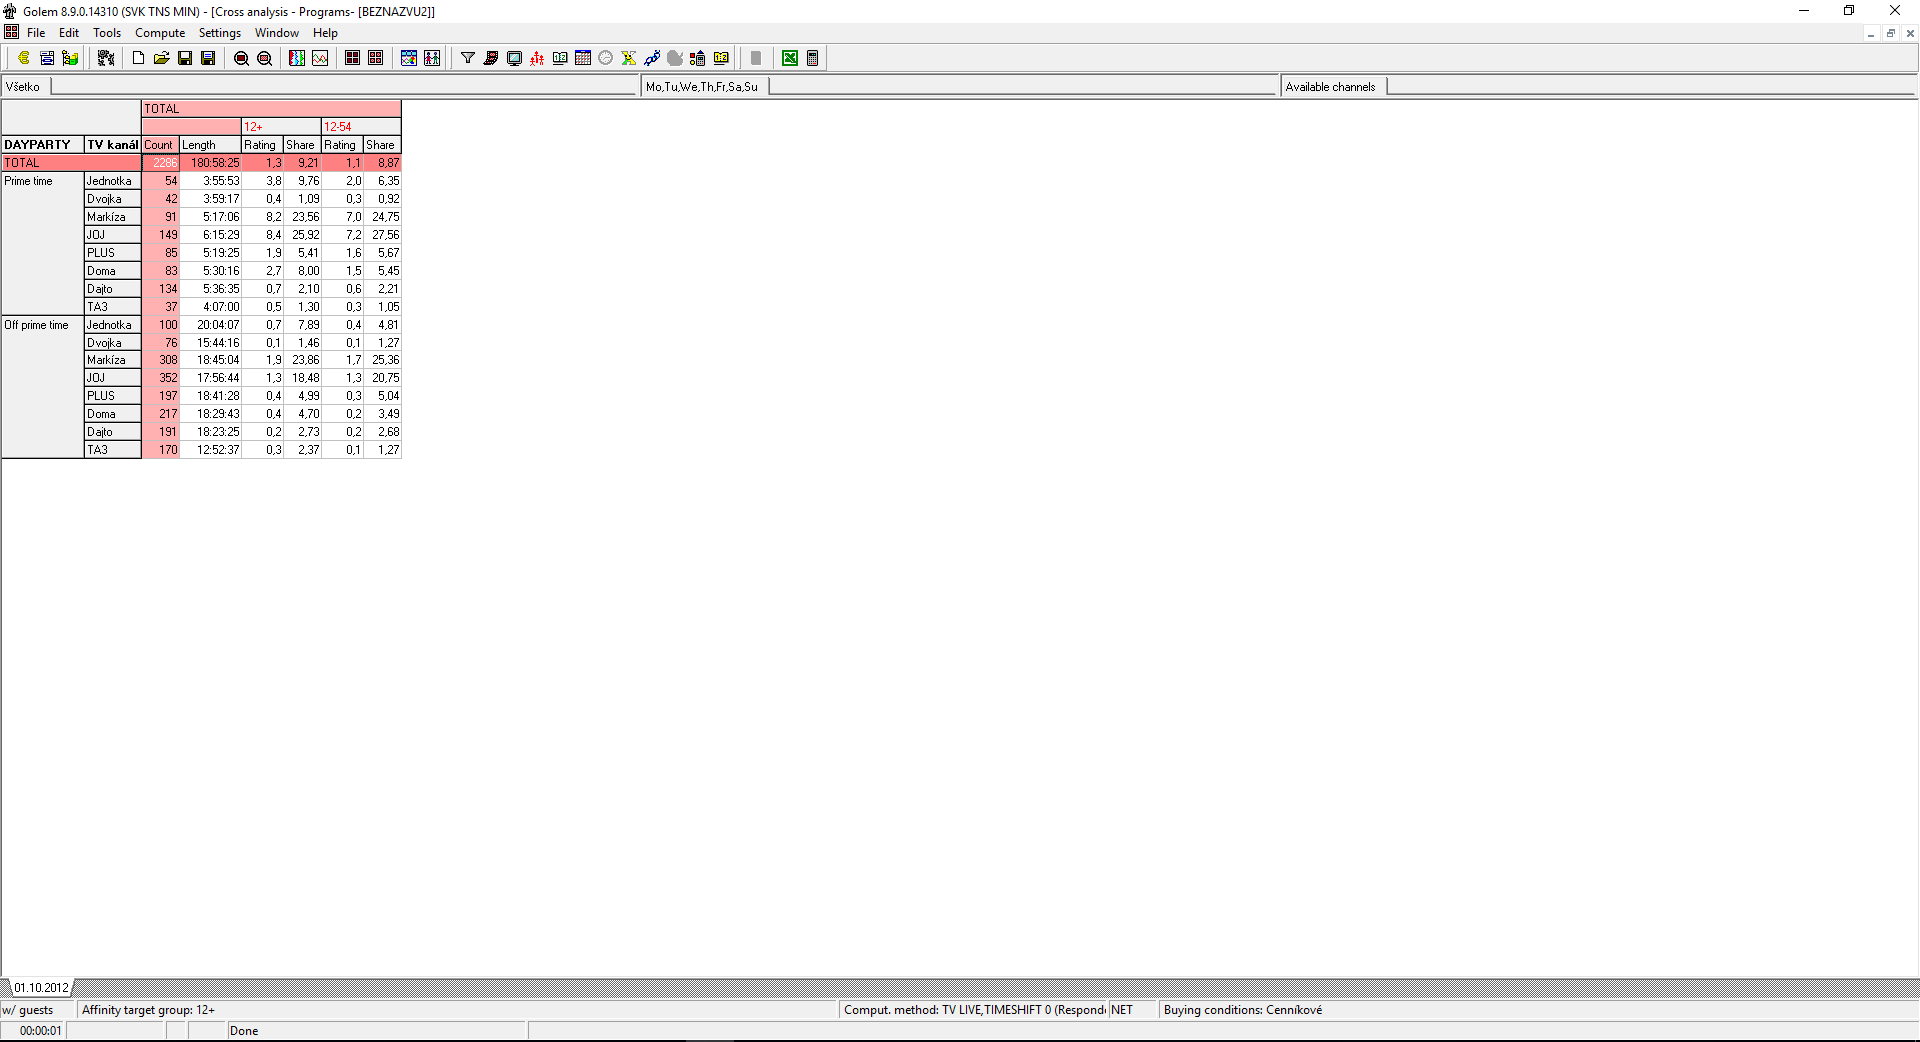
Cross analyses
are used for analyzing programmes (breaks, spots, captions) accumulations that can be created by multi-level aggregation of database or generated variables. Cumulates parts of analysis either into rows or to columns, even for more variables at once. The analysis provides wide range of computed figures as well as percentage distributions of selected subtotals.
You can for example analyze channel division of advertisement for non-alcoholic drinks cumulated by their type and brand.
|
|
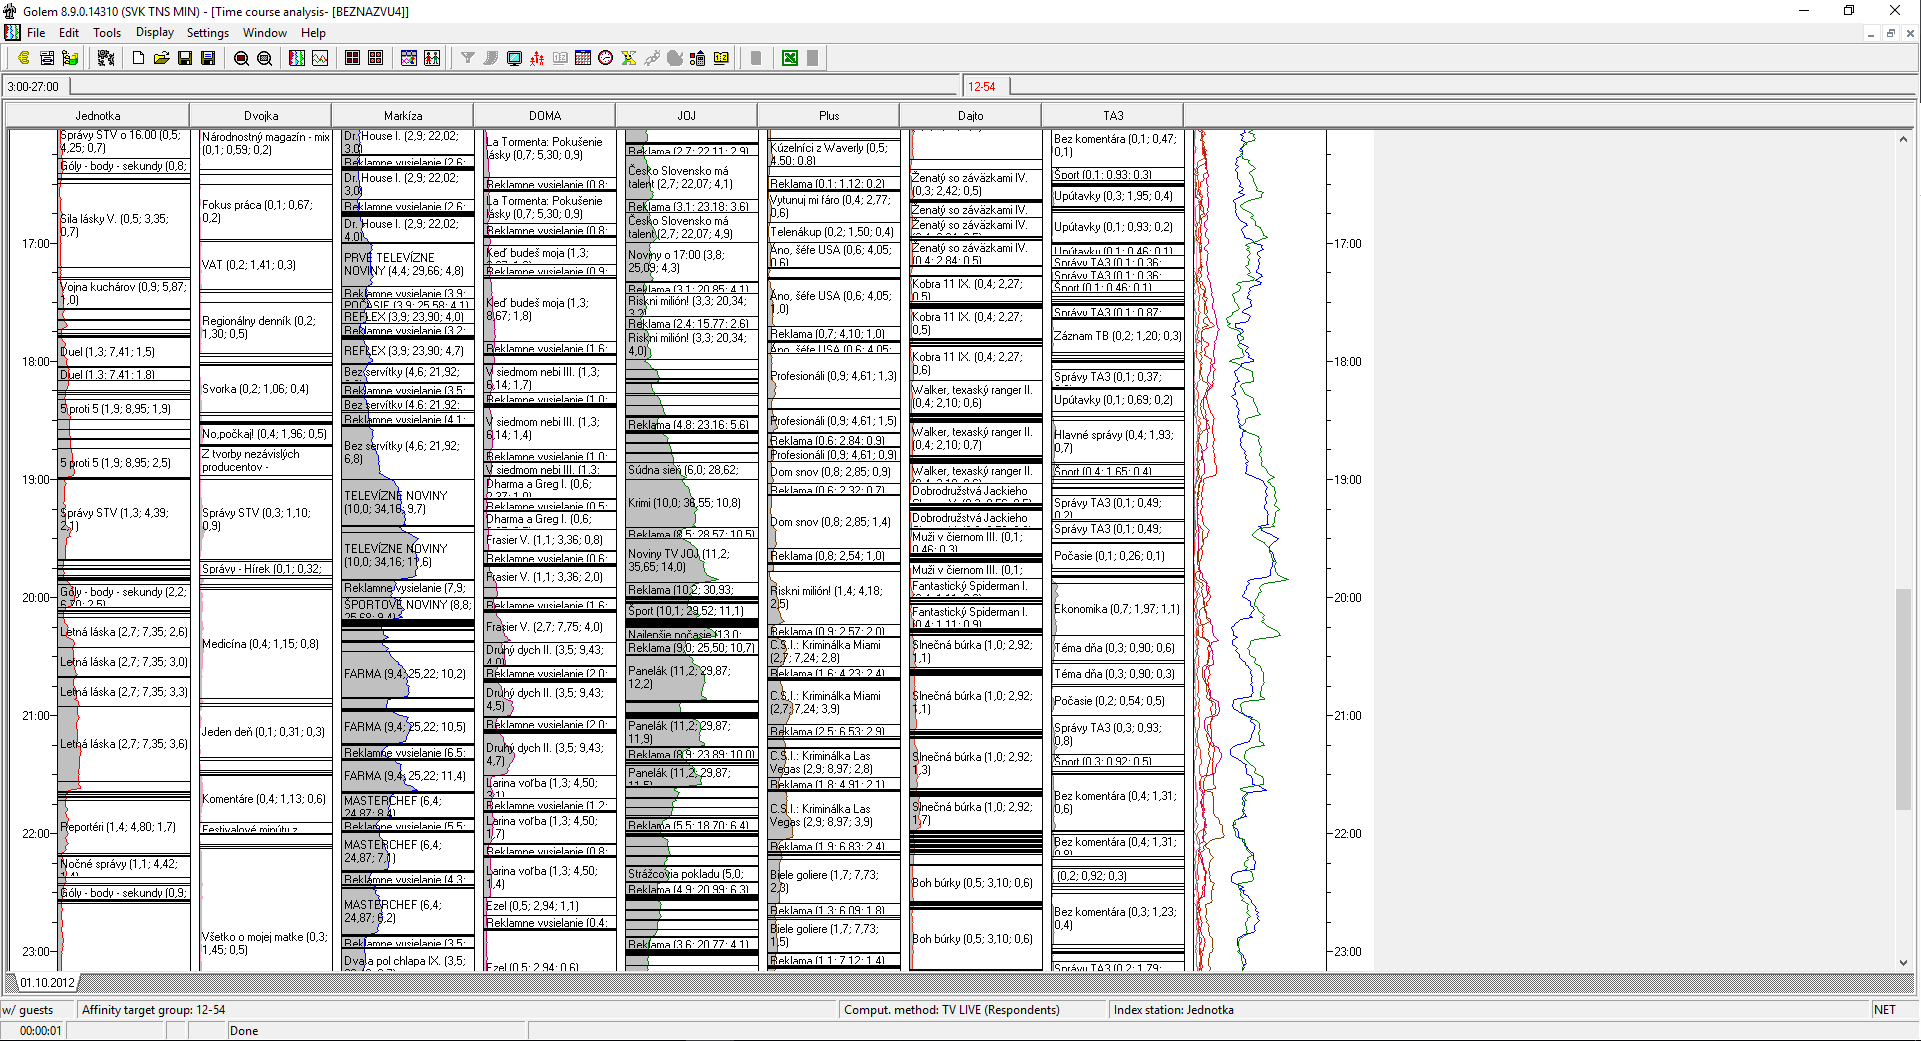
Time course analysis
graphically demonstrates broadcast course of selected channels represented by basic variables (e.g. rating and share, affinity, …). The graphic report is widely modifiable and can be saved in various graphic formats or exported by clipboard to other applications.
 |
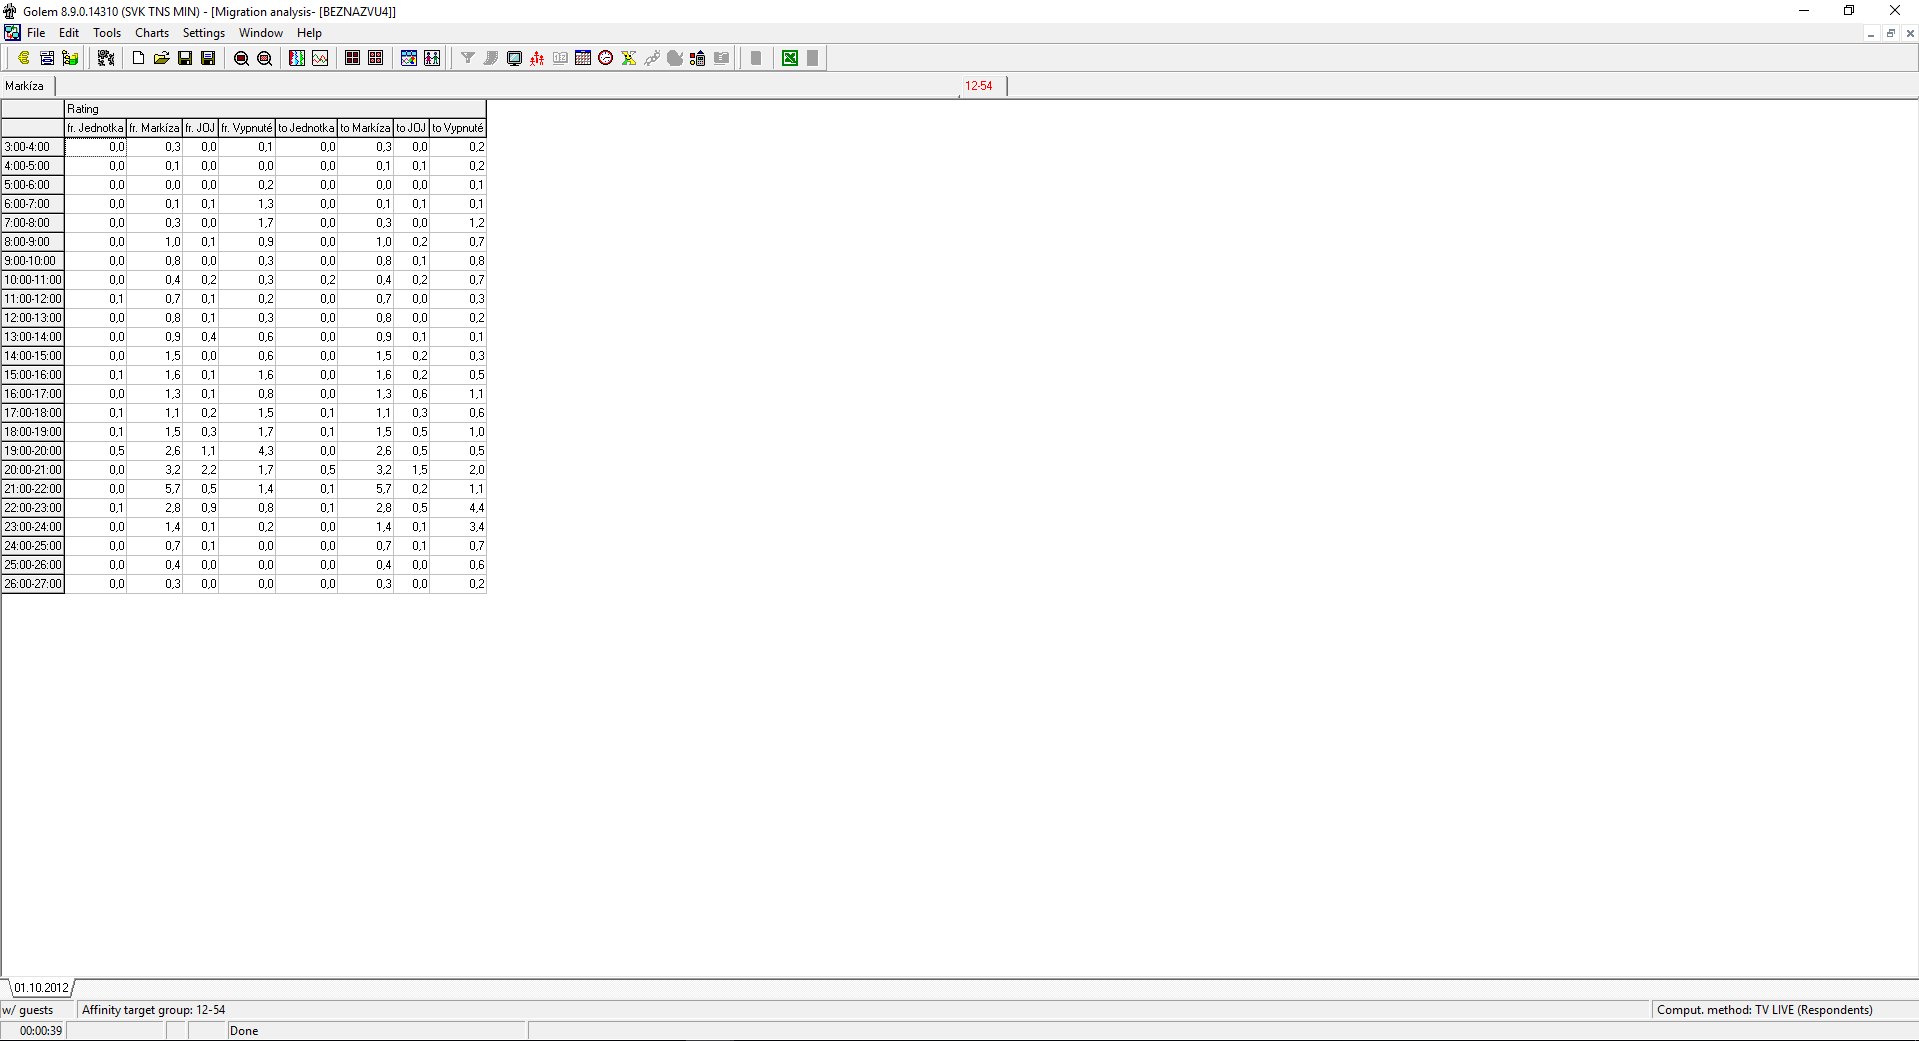
Audience migration analysis
facilitates analyses of spectators’ switching between channels included in TV meter data and also their switching off and on of the TV. This channel migration can be examined in user-defined time intervals (up to the seconds).
A component of the analysis is a Respondents analysis, which displays sociodemographic information about respondents, who switched channel in selected area of the table (i.e. time interval and TV channel). Furthermore you can create special target group from these respondents. Afterwards this target group is available in all analyses in programs Golem and Mamut.
 |
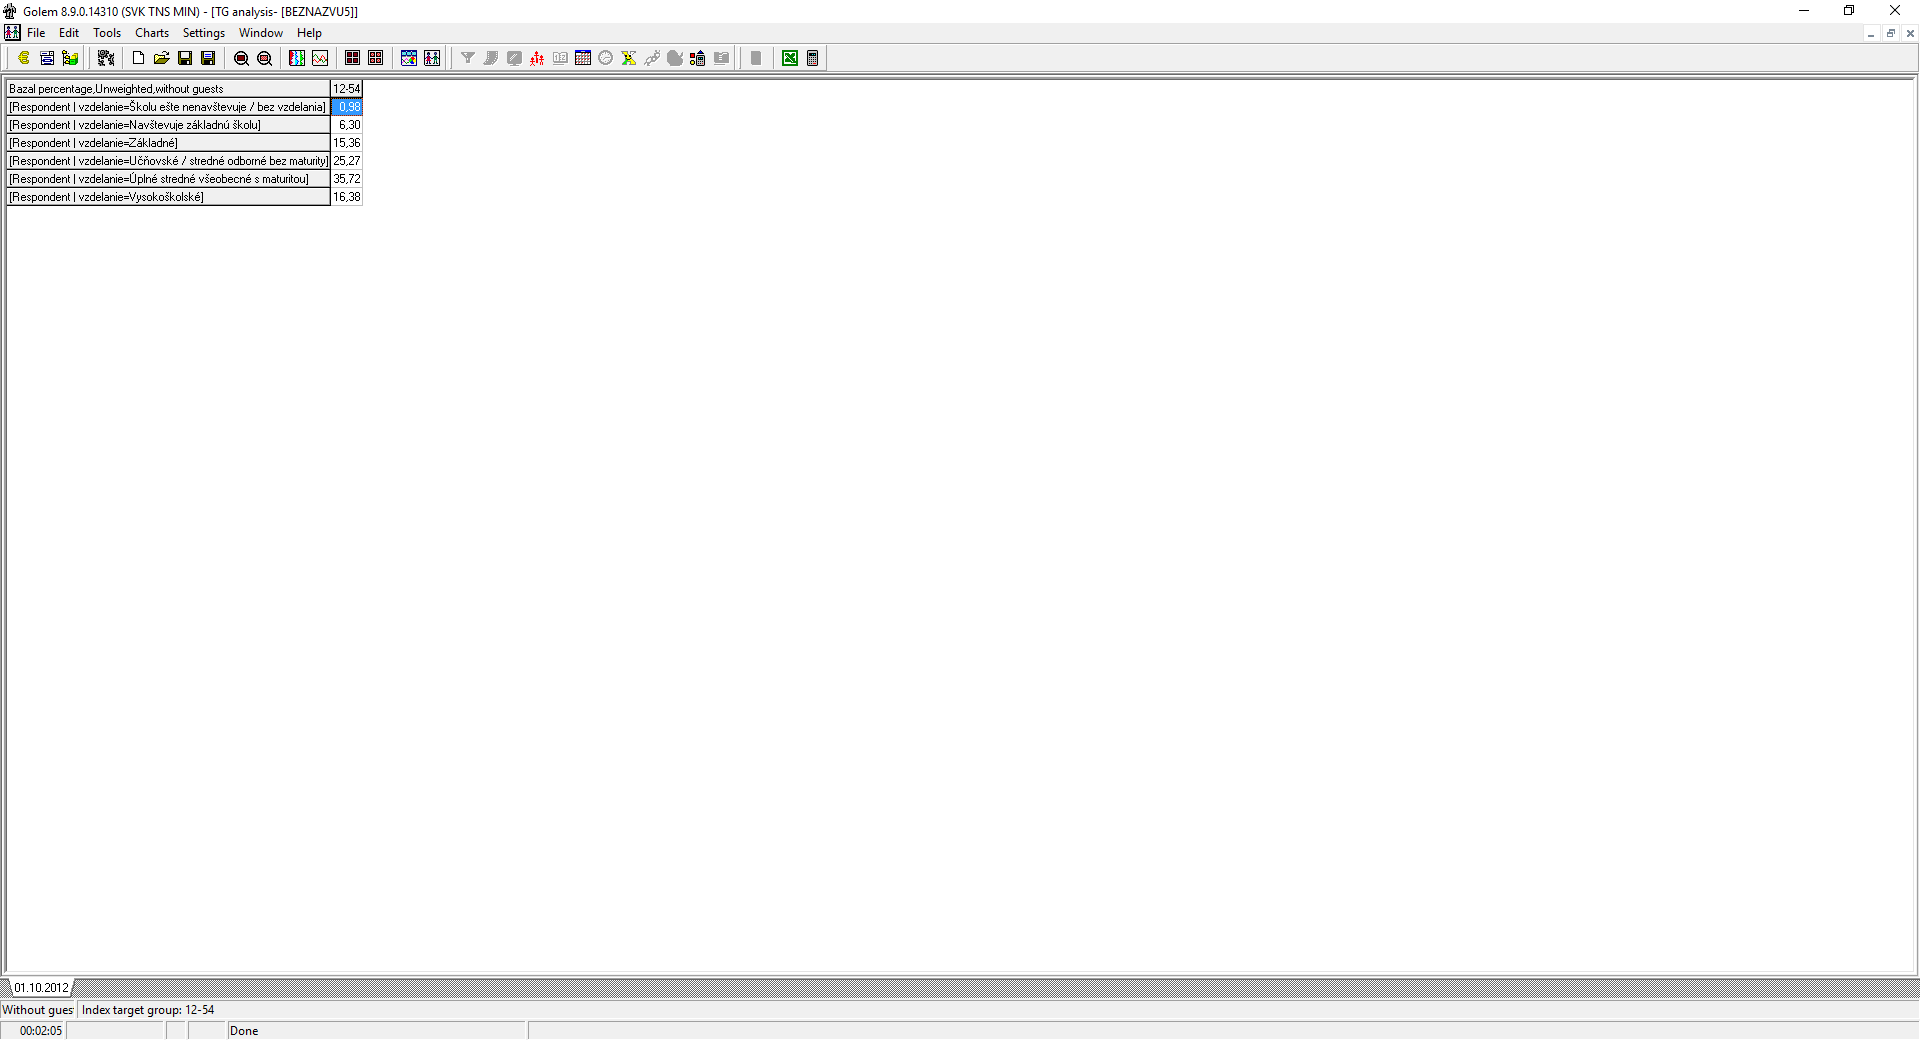
Target group analysis
helps you to fully analyze sociodemographic characteristics of respondents from whole panel or selected (even special) target group. It calculates sociodemographic distribution defined by particular qualitative characteristic (e.g. a percentage of unemployed people in a selected target group). It’s useful mainly when analyzing special target groups made in Golem or Mamut (e.g. the sport programmes spectators).
|
|
Videoanalysis
is a special multimedia analysis, which besides several graphic and table reports of various audience figures, displays (and plays) digitized TV broadcasting of selected TV channels.
To work with Videoanalysis you need a digitized broadcasting in addition to the standard TAM data.
In the Videoanalysis you can display and use these components:
- panel with video screens for selected TV stations,
- rating graph,
- actual time (of the broadcasting) share graph,
- programmes information table,
- time courses with actual time pointer,
- audience migration with analysis of incoming and outgoing respondents.
You can also calculate and display so called “critical points” (e.g. significant increases and decreases of ratings on selected TV).
Graphic audience analysis
makes graphical groups from respondents with common audience behavior on selected TV channels and helps you to indicate viewing behavior of individual respondents in a selected time interval in a graphic output.
You can also use a “zoom” function to point out a specific group of respondents and then analyze them in the Respondent analysis and/or create a special target group for additional analyses.