


Yetti
Program Yetti in an analytical tool for work with data from a complete advertisement monitoring. The desired output can be achieved by using several useful functions:
- Possibility to re-code database items with external, user-defined codelists
- Possibility to compute audience figures for TV spots
- Possibility to compute readership for press and listening figures for radio from data available on the market
- Multiple analyses batch procesing
- Export of the results to external formats for a further usage
- and more

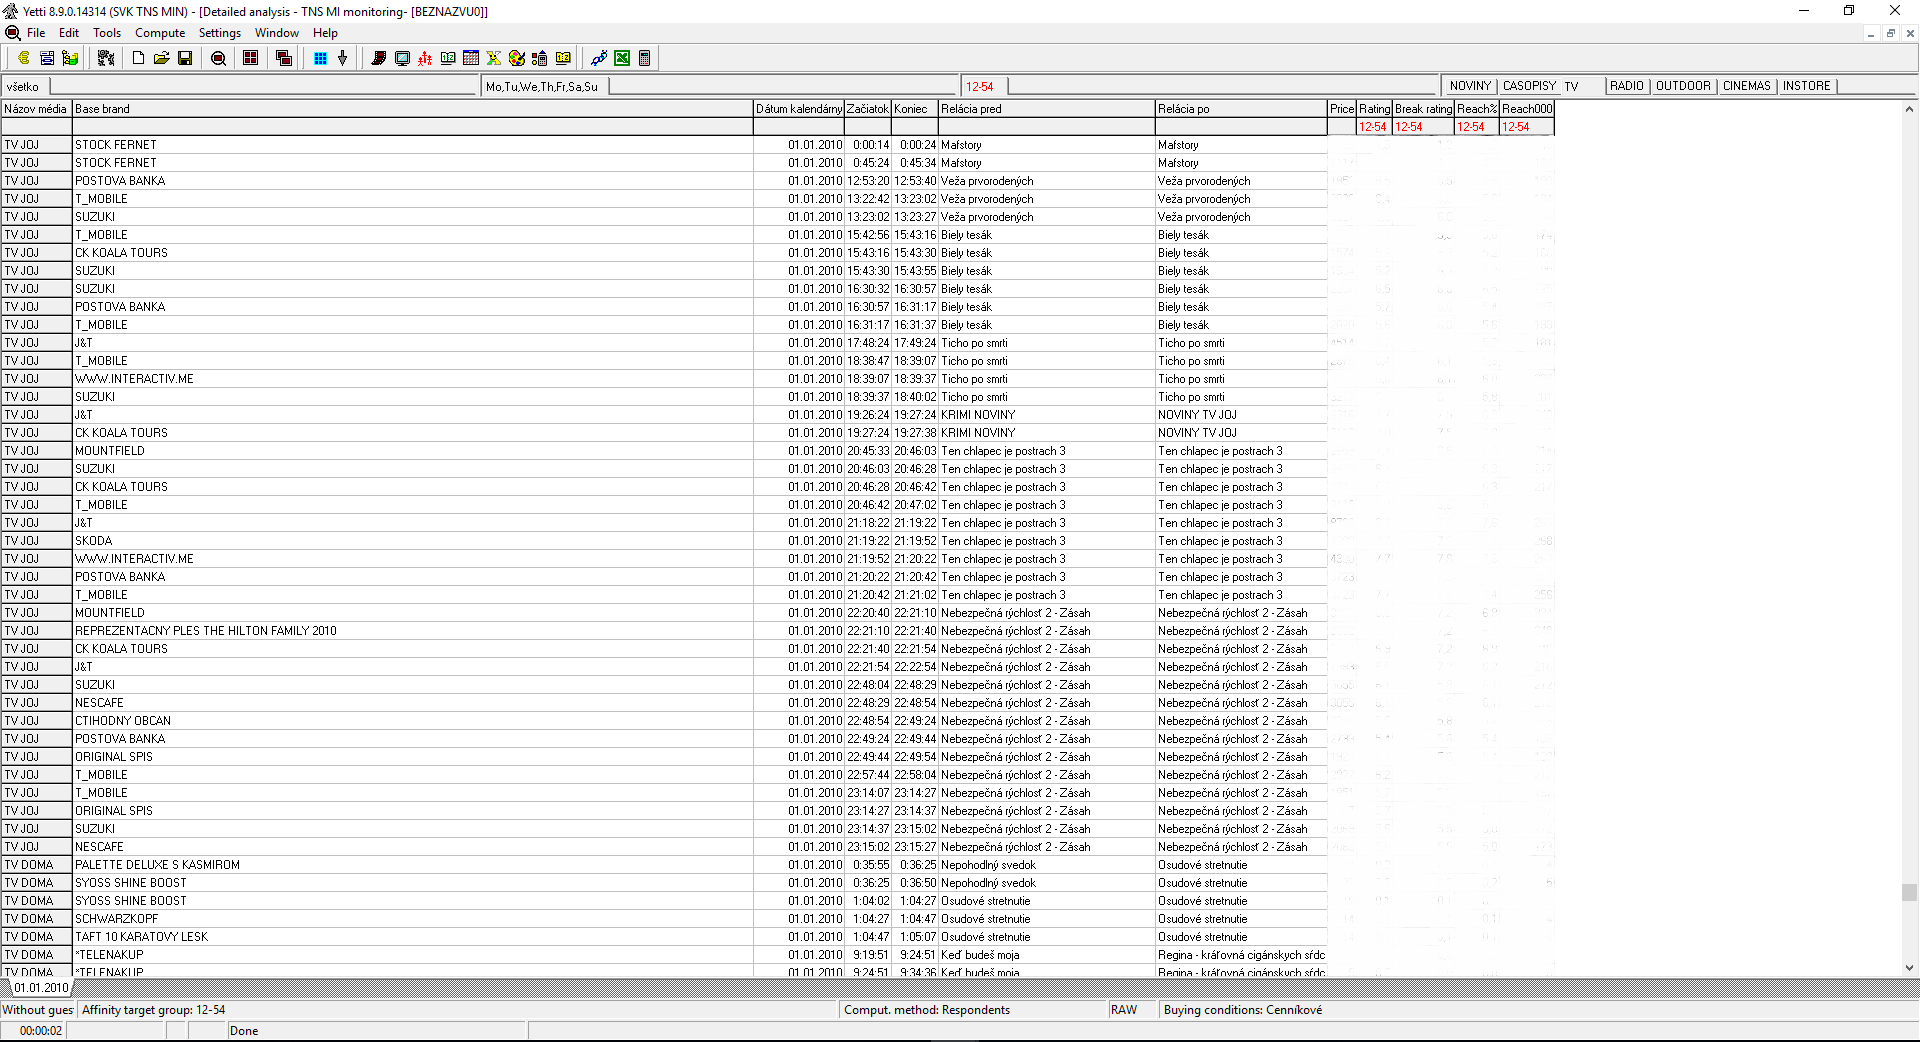
Detailed analysis
is used for analysing particular advertisement events (spots, press ads, …). The final output is modifiable by various parameters’ settings and by predefined display options.
You can use folowing parameters and analysis functions:
- Row cumulation (by selected criteria)
- Conditional colouring of parts of the analysis
- Sort and trim
- Diplayed events filter
| show preview (Detailed analysis) |
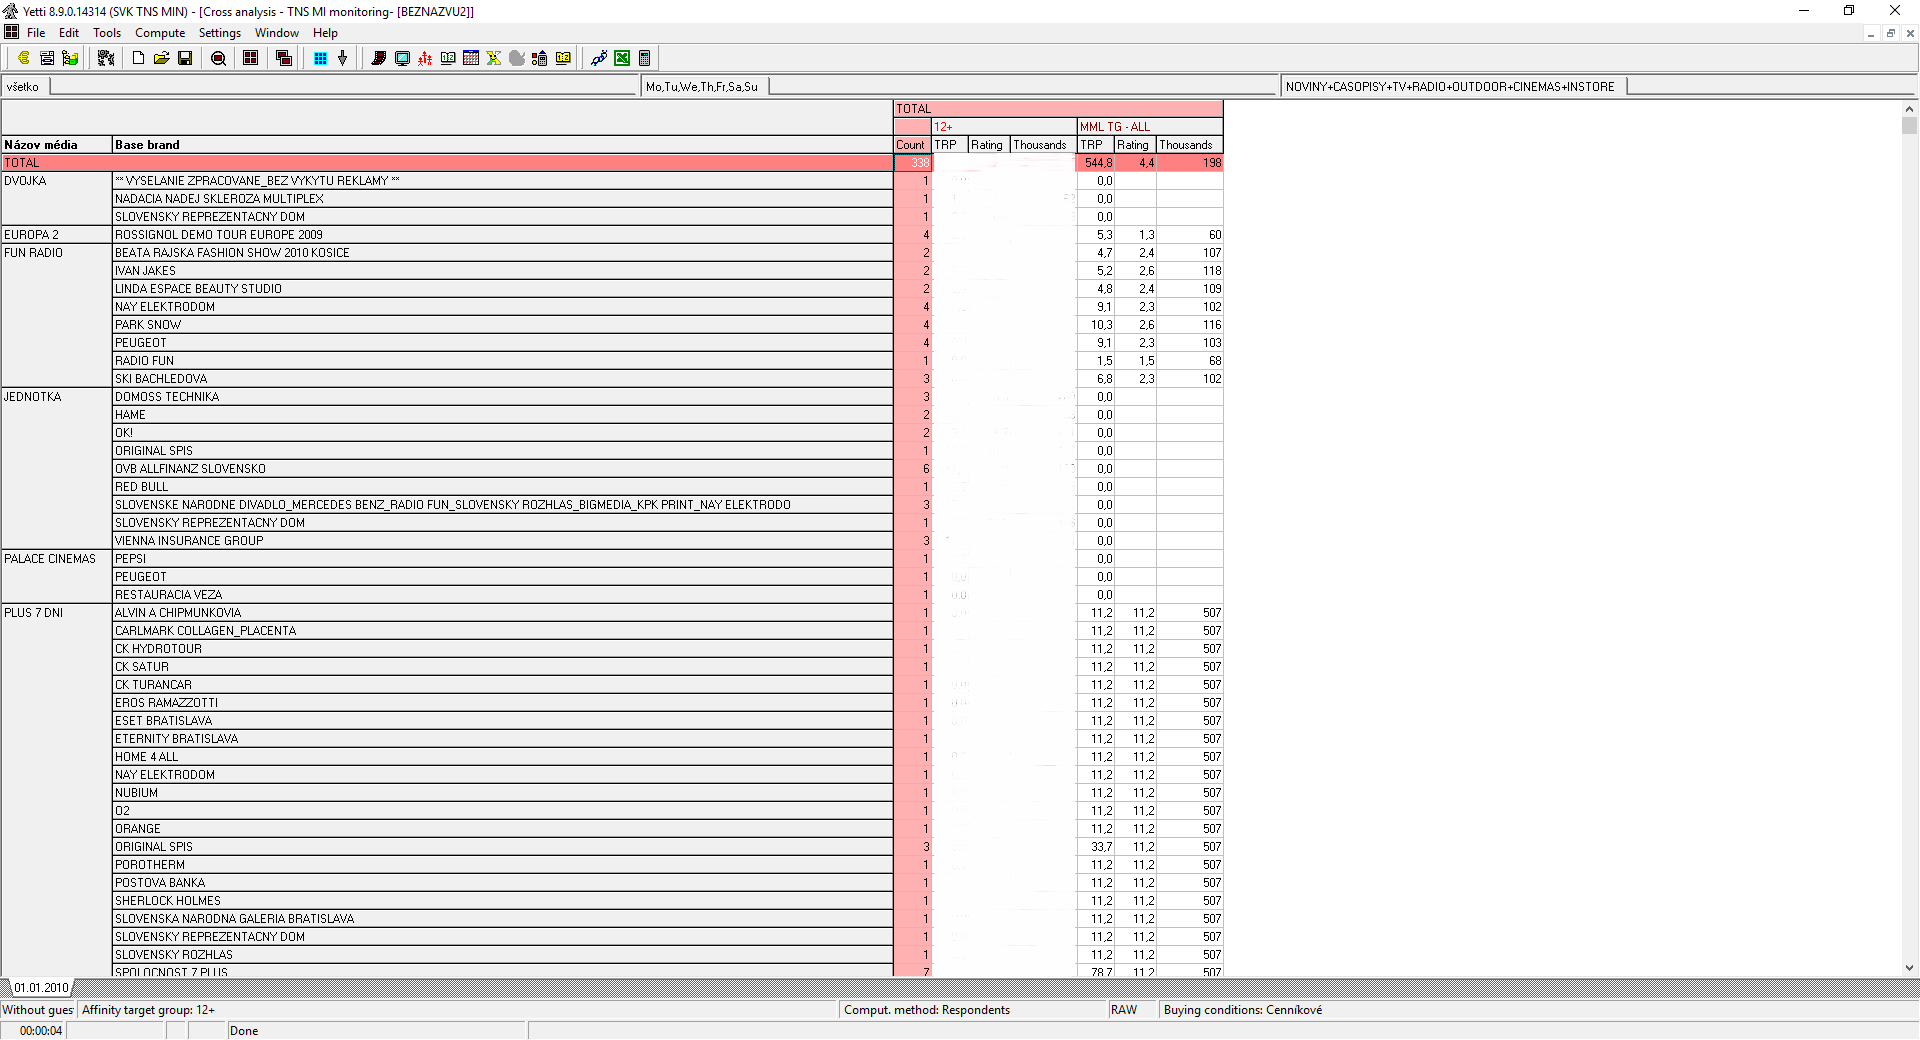
Cross analysis
is used for analyzing advertising events accumulations that can be created by multi-level aggregation of database or generated variables. Cumulates parts of analysis either into rows or to columns, even for more variables at once. The analysis provides wide range of computed figures as well as percentage distributions of selected subtotals.
You can for example analyze monthly volumes of advertisements for particular brands divided into selected media types.
| show preview (Cross analysis) |
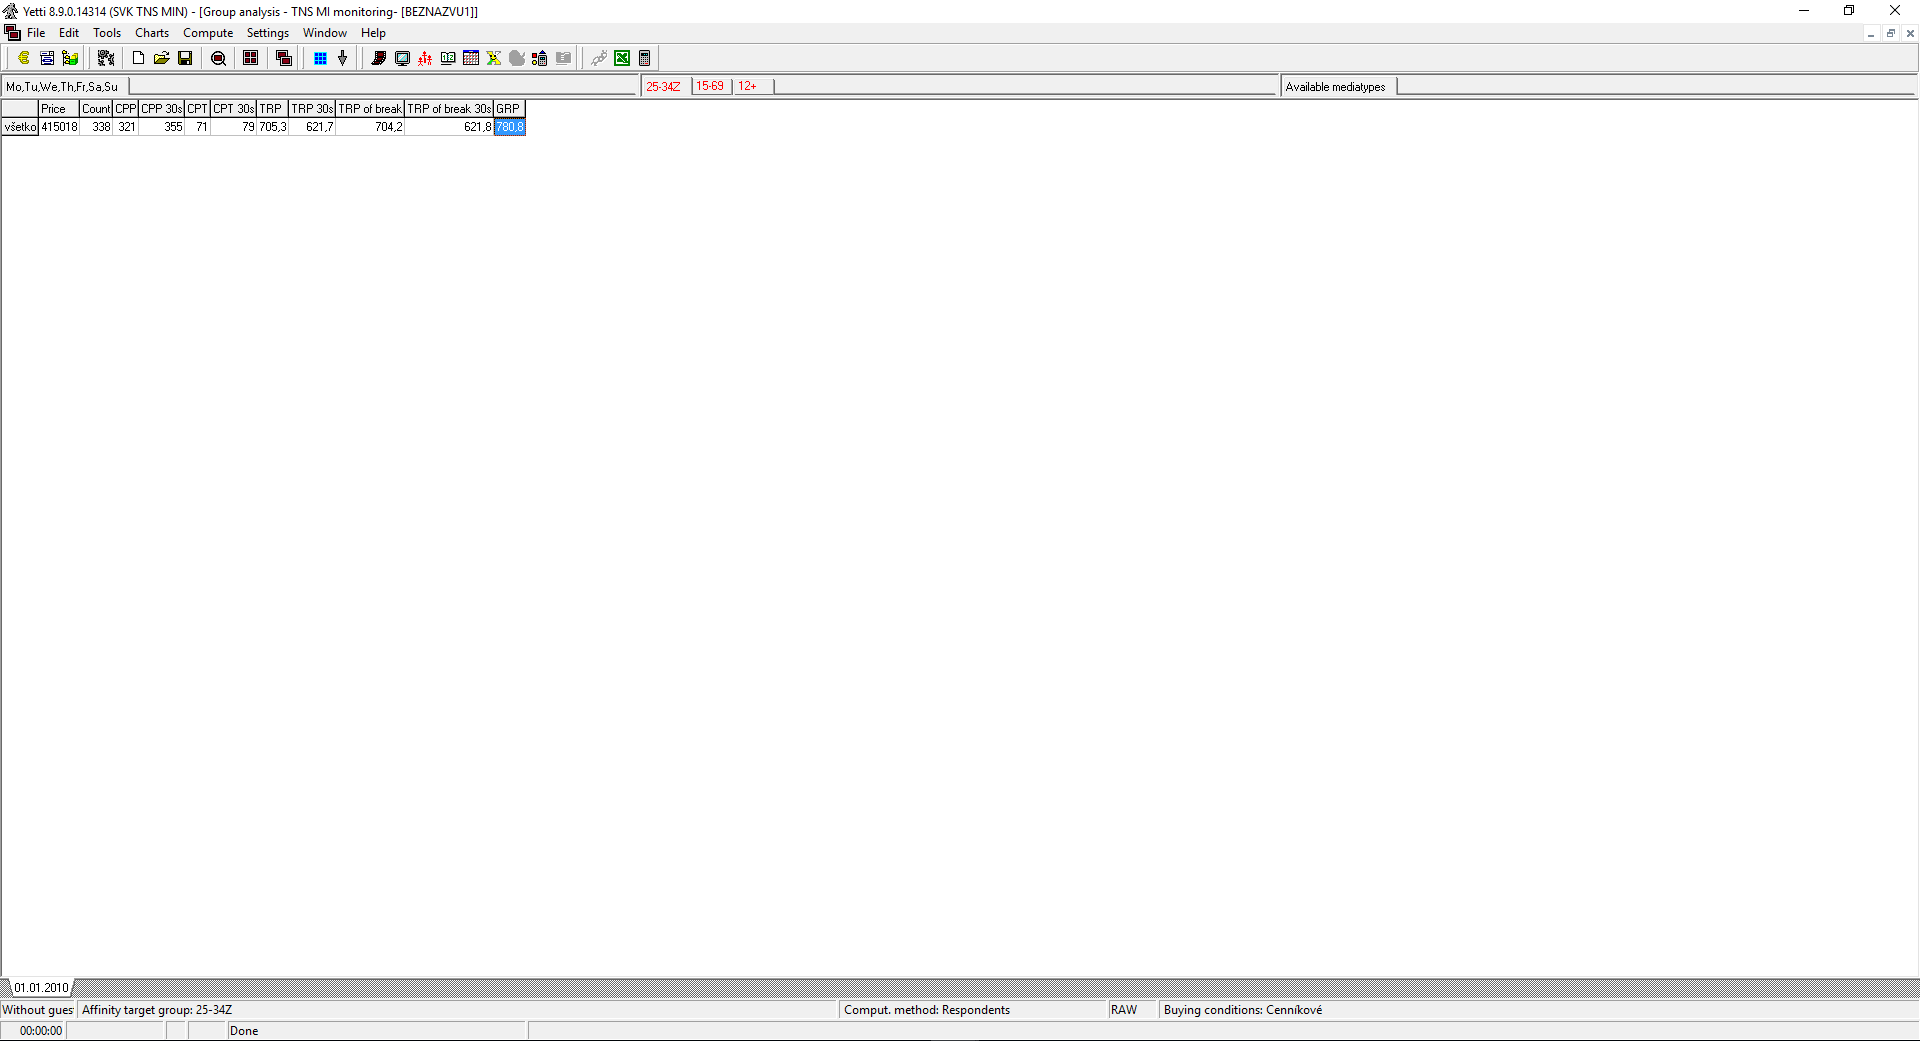
Group analysis
is used for specific analyses of user-defined accumulations of advertising events.
| show preview (Group analysis) |